
AAEP equine veterinarians, 2005-2018
The American Association of Equine Practitioners publishes its global membership numbers each year in its annual report. Women equine veterinarians outnumber men, according to the AAEP. Total membership peaked in 2008, just as the recession took hold and led to a big drop in the horse population. The association no longer makes its annual report available publicly.
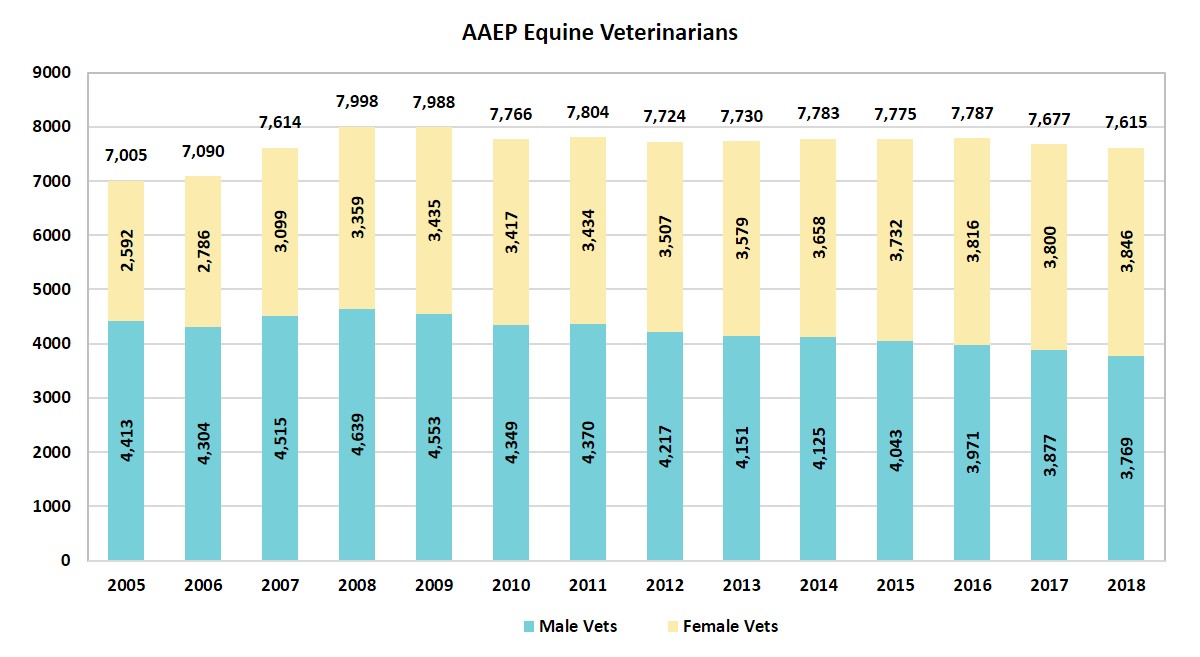
| Year | Total | Percent Male | Total Male | Percent Female | Total Female |
|---|---|---|---|---|---|
| 2018 | 7,615 | 49.5 | 3,769 | 50.5 | 3,846 |
| 2017 | 7,677 | 50.5 | 3,877 | 49.5 | 3,800 |
| 2016 | 7,787 | 51.0 | 3,971 | 49.0 | 3,816 |
| 2015 | 7,775 | 52.0 | 4,043 | 48.0 | 3,732 |
| 2014 | 7,783 | 53.0 | 4,125 | 47.0 | 3,658 |
| 2013 | 7,730 | 53.7 | 4,151 | 46.3 | 3,579 |
| 2012 | 7,724 | 54.6 | 4,217 | 45.4 | 3,507 |
| 2011 | 7,804 | 56.0 | 4,370 | 44.0 | 3,434 |
| 2010 | 7,766 | 56.0 | 4,349 | 44.0 | 3,417 |
| 2009 | 7,988 | 57.0 | 4,553 | 43.0 | 3,435 |
| 2008 | 7,998 | 58.0 | 4,639 | 42.0 | 3,359 |
| 2007 | 7,614 | 59.3 | 4,515 | 40.7 | 3,099 |
| 2006 | 7,090 | 60.7 | 4,304 | 39.3 | 2,786 |
| 2005 | 7,005 | 63.0 | 4,413 | 37.0 | 2,592 |
Source: American Association of Equine Practitioners' published annual reports, 2005-2018